Rivian’s boss said the new R2 is as efficient as a Tesla Model Y — and on paper, the window stickers agree. So Out of Spec Reviews did the only honest thing: they rented a highway, lined up both Performance SUVs, and made them run the same road at 50, 60, 70 and 80 mph. The R2 didn’t just lose. It lost by as much as 26%. Here’s what the numbers actually say, and why the EPA label is the worst place to start this argument.
The claim that launched a thousand replies
At the R2 launch, Rivian CEO RJ Scaringe told assembled media — including Out of Spec’s Kyle Conner — that the R2 uses “as efficient on a watt-hour per mile or miles per watt-hour basis” as the Tesla Model Y, “despite the capabilities that it has and despite the form factor that we’ve intentionally chosen.” It’s a seductive line. The R2 is taller, boxier and roughly 530 lb heavier than the Model Y, so matching Tesla’s drag-defying slipperiness would be a genuine engineering flex.
The official EPA numbers seemed to back him up. Both the 2026 Rivian R2 Performance and the 2026 Tesla Model Y Performance carry an identical 105 MPGe combined rating and the same 32 kWh per 100 miles consumption. The R2 even “wins” the city cycle, 114 MPGe to 111, while the Model Y takes the highway, 100 to 96. On the sticker, these two are twins — which is exactly why the real-world gap is so uncomfortable.
How Out of Spec actually tested it
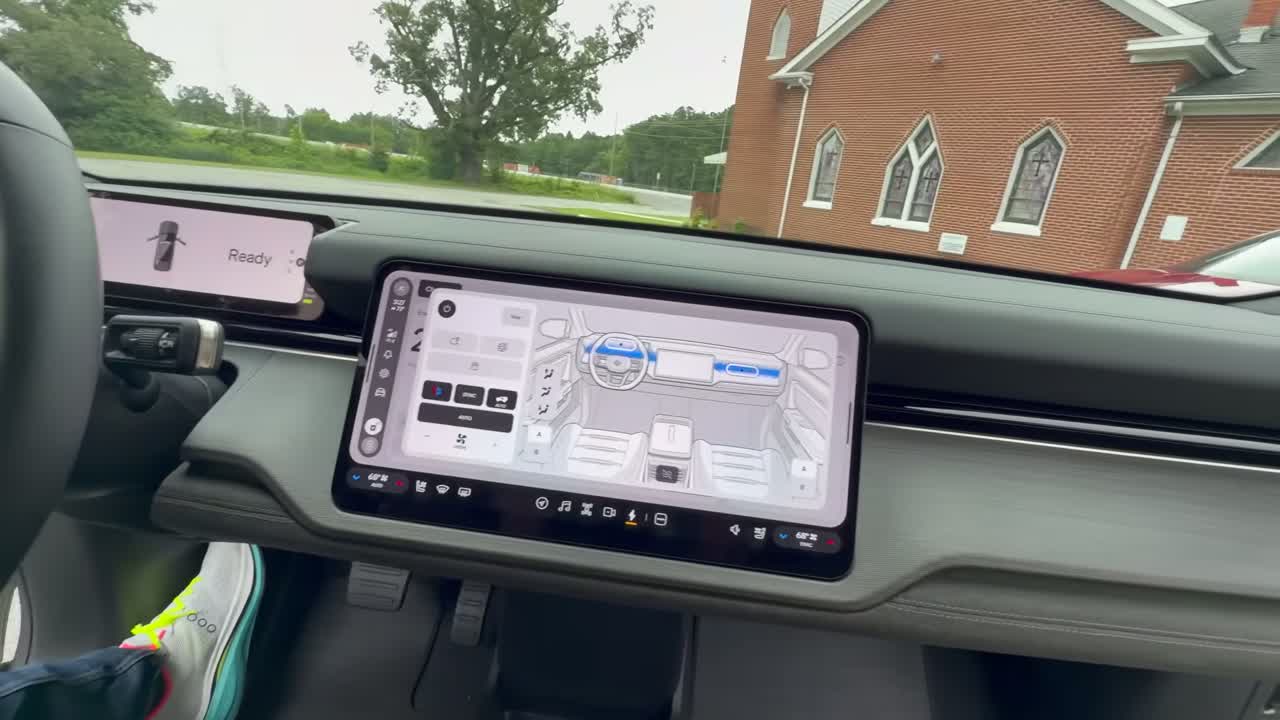
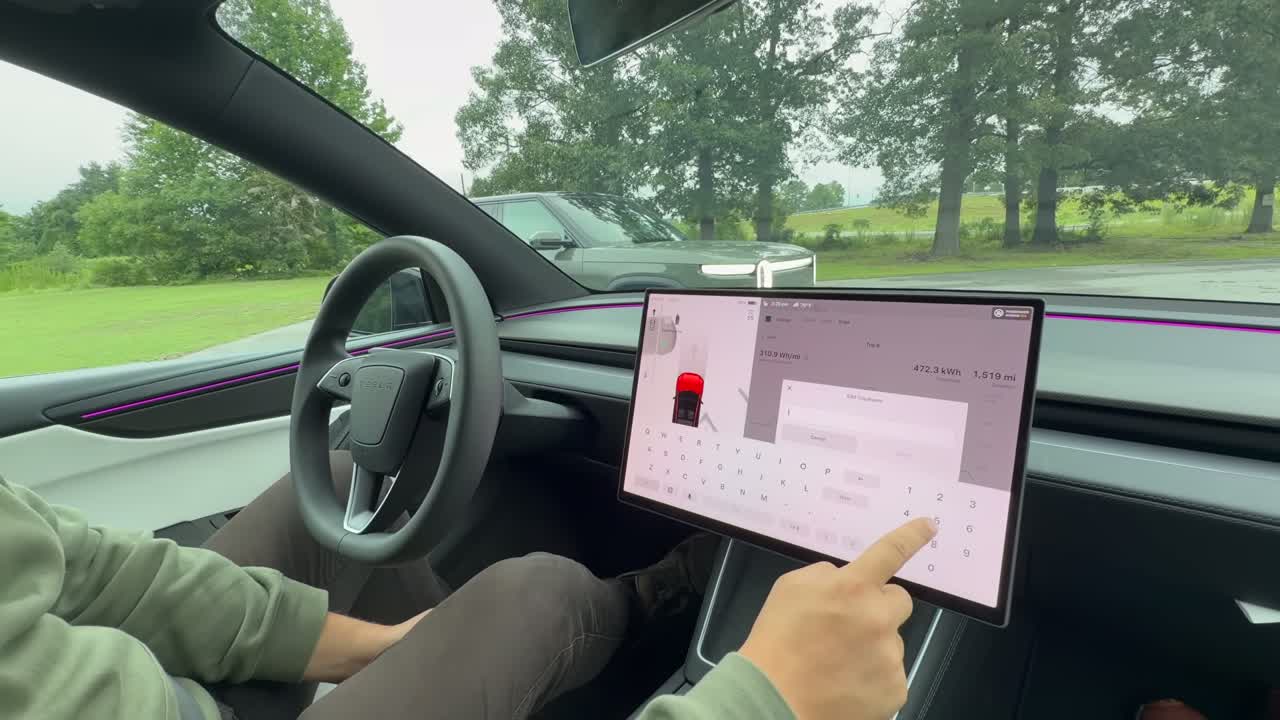
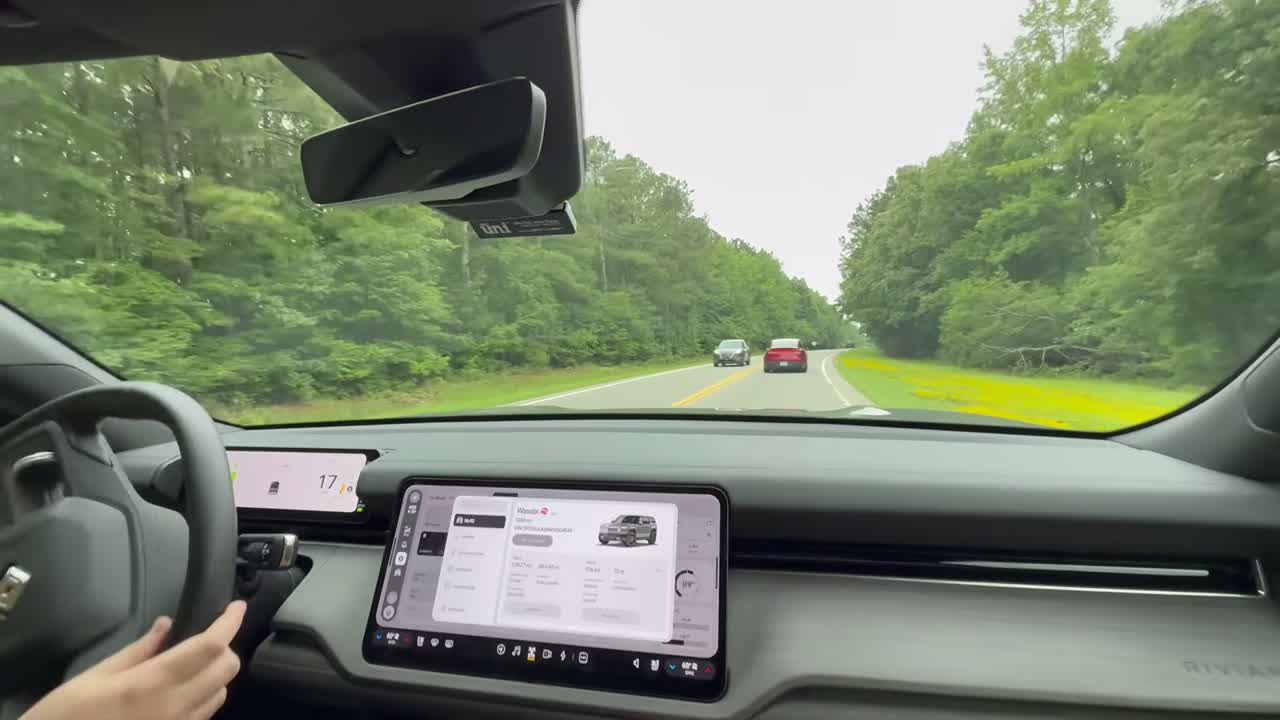
This wasn’t a spec-sheet debate. Conner and RivianTrackr’s Jose put a stock R2 Performance and a media-loan Model Y Performance on the same afternoon, on the same roads, in as close to identical conditions as two cars can get:
- Out-and-back loops at 50, 60, 70 and 80 mph (GPS), swapping the lead each leg so neither car could draft the other.
- Original equipment tires, set to 42 psi cold with the same gauge; two occupants per vehicle.
- Climate on auto at 68°F with rear vents off; R2 in Conserve mode, Model Y in Chill.
- Energy measured by kWh consumed rather than the cars’ own efficiency readouts, because the two odometers disagreed by about 1.7%.
Then they built a 20-minute low-speed, stop-and-go “city” simulation around a quiet track — the one scenario where the R2’s trick front-motor disconnect should have helped most.

The numbers don’t lie
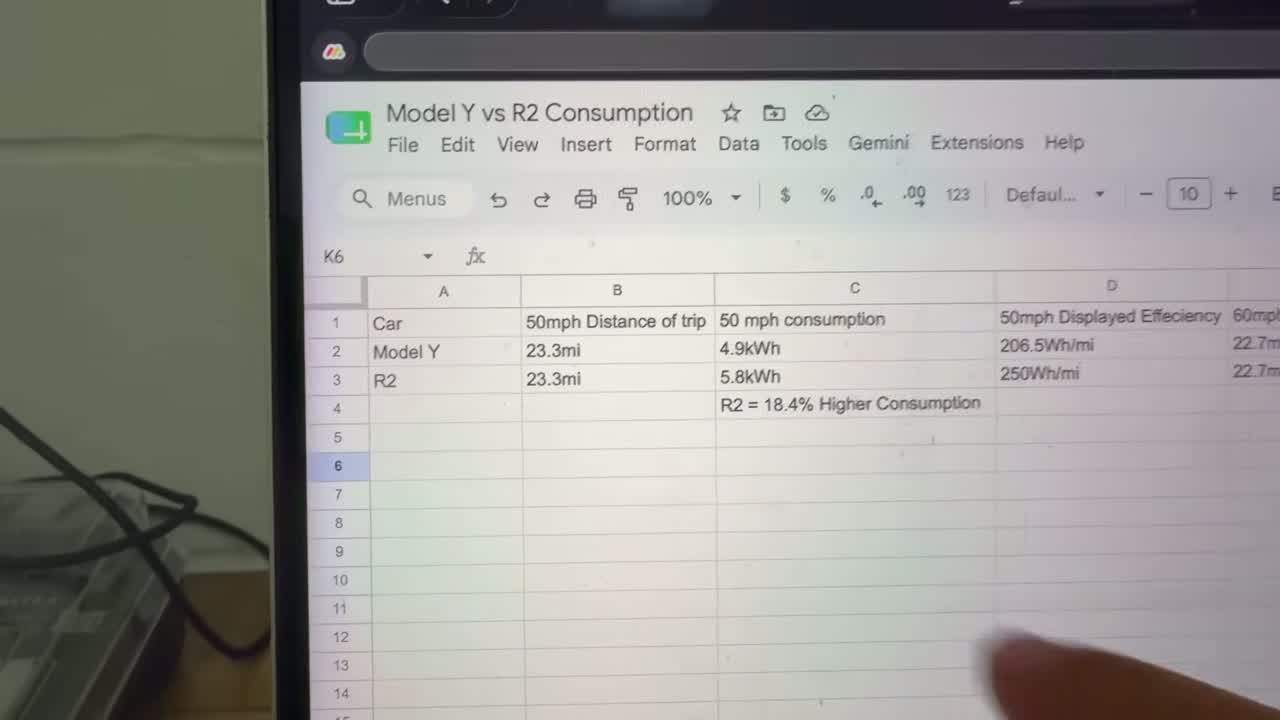
Across every single speed, the R2 drank more. The gap below is how much more energy the R2 used than the Model Y at the same cruise speed.
| Cruise speed | R2 extra energy vs Model Y | R2 efficiency (mi/kWh) |
|---|
| 50 mph | +18.4% | 4.00 |
| 60 mph | +~26% | 3.15 |
| 70 mph | +~20% | 3.06 |
| 80 mph (≈30-mi loop) | +26.5% | 2.46 |
| City / stop-and-go sim | +~25% | 1.9 kWh vs 1.6 kWh |
The 70-mph figure is the soft spot in the data: that loop ran on I-95 at 5 p.m. in heavy traffic, and both upright bodies picked up a slipstream from nearby trucks. Treat it as the outlier. Every other point tells the same story, and the widest split — 26.5% at 80 mph over a clean 30-mile run — is the cleanest result of the day.
Reading the signal
Stack the headline findings and the pattern is obvious: the faster you go, the more the R2’s shape punishes it.
50 mph efficiency gap
60 mph efficiency gap
80 mph efficiency gap
City-sim efficiency gap
That’s the whole thesis in four bars: a “shoebox” with 530 extra pounds and an estimated drag coefficient near 0.28–0.29 (versus the Model Y’s 0.22) simply cannot hide at speed. The R2 is a genuinely efficient vehicle for its size — Conner repeatedly stresses it would crush a Hyundai IONIQ 5 or anything else in its weight class — but it never gets within shouting distance of the least-efficient Model Y.
Why two “identical” EPA stickers tell different stories
Here’s the part almost nobody explains. The EPA lets EV makers reach their label number through more than one door. The cheap, common path: run the car on the city cycle until the battery dies, run the highway cycle until it dies, then multiply by a blanket 0.7 correction factor. The expensive path is the full multi-cycle “5-cycle” test — four city cycles, two highway, two constant-speed cycles — which actually measures hot, cold and high-speed behavior instead of estimating it.
Out of Spec’s read of the certification paperwork: the R2 appears to have run the full five-cycle test at a lab in Michigan, while the Model Y’s figure looks derived from a shorter set of cycles plus an EPA-approved correction. That’s the “apples-to-oranges” the hosts kept coming back to. It matters because the two routes can land on the same headline MPGe while hiding very different real-world curves.
There’s a second wrinkle. EPA’s kWh/100-mile figure is measured at the wall, so it bakes in charging losses. Out of Spec measured energy leaving the battery. Back the label math out and EPA is effectively crediting the R2 at about 3.75 mi/kWh from the pack versus the Model Y’s 3.64 — EPA has the R2 a hair ahead, while the road had it 18–26% behind. The label and the highway are not the same instrument.
“Everyone needs to stop saying that it’s matching the efficiency of the Model Y, because it just isn’t.” — Kyle Conner, Out of Spec Reviews
Cross-brand, cross-market, cross-time
Put the R2 in context and the result is less shocking than the headline gap suggests:
- Cross-brand (IONIQ 5): The 2026 Hyundai IONIQ 5 AWD lands at roughly 94–115 combined MPGe depending on trim. The R2’s real-world curve sits right in that pack — it’s the Model Y that is the outlier, not the Rivian.
- Cross-market (China): The same “Model Y” nameplate is rated on China’s CLTC cycle at up to 821 km — a reminder that the 306-mile EPA figure is a deliberately conservative US number, and that “range” is a moving target defined by whoever runs the test.
- Cross-time: Tesla has played the favorable-adjustment game longer than almost anyone. Car and Driver documented back in 2020 that Tesla’s alternate methodology earned the Model Y Performance a 24.4% adjustment versus the default 30% — turning a would-be 292-mile rating into 315. The 2008 EPA overhaul that created these two paths is the reason a “105 MPGe” can mean two different things.
So who should actually buy the R2?
The efficiency gap is real, but it is not the whole buying decision. The R2 Performance starts at $57,990 (Rivian lists the Launch Edition at that figure), carries 87.9 kWh of usable battery versus the Model Y’s ~75 kWh, and posts a longer 330-mile EPA range. It also offers more ground clearance, a genuine off-road drive mode, and a frunk big enough for a carry-on — things the slick Model Y simply isn’t built to do. Remember the federal $7,500 EV tax credit expired for vehicles placed in service after September 30, 2025, so neither SUV gets that discount anymore; the math is now pure sticker-versus-efficiency.
Built-in NACS means both can plug into the Tesla Supercharger network, and the R2’s 210-kW peak is complemented by Rivian’s growing Ionna partnership for fast, easy public charging. If your priority is squeezing the most miles from the least electricity, the Model Y remains the benchmark. If you want the boxier, more capable, longer-range body and can live with giving back 18–26% at highway speed, the R2 is still one of the most impressive efficiency stories of any non-Tesla crossover its size.
Wait — if the EPA ratings are the same, is the R2 lying about efficiency?
No. Both numbers are legitimate EPA labels; they were just reached through different approved test procedures and correction factors. The R2 genuinely is extraordinarily efficient for a 4,998-lb, off-road-minded SUV. The issue is that “105 MPGe combined” for the R2 and “105 MPGe combined” for the Model Y describe two different real-world curves, so buyers shouldn’t read the matching stickers as a matching driving experience.
Does the R2’s front-motor disconnect help at all?
It helps, just not enough to close the gap. Disconnecting the front permanent-magnet motor on the highway lets the R2 cruise as a pure rear-drive EV without dragging a spinning idle motor — an advantage the Model Y doesn’t have. Even so, the R2 used about 25% more energy in the low-speed simulation where that trick should have mattered most, because aero and weight dominate the rest of the equation.
Which speed should I care about most?
If you live in city traffic, the gap narrows to roughly 18–25%. If your commute is a 70–80 mph highway run — the reality for most US interstates — the R2 gives back the most ground, costing you 20–26% more energy per mile than the Model Y. Plan road trips around the 80-mph number, not the combined sticker.
Related reading on EVCUBE