The US fast-charging network quietly crossed 77,000 public DC plugs in mid-2026 — but the bigger story for American drivers is who is building them, how fast they charge, and whether they actually work when you pull up.
How big is America’s fast-charging network right now?
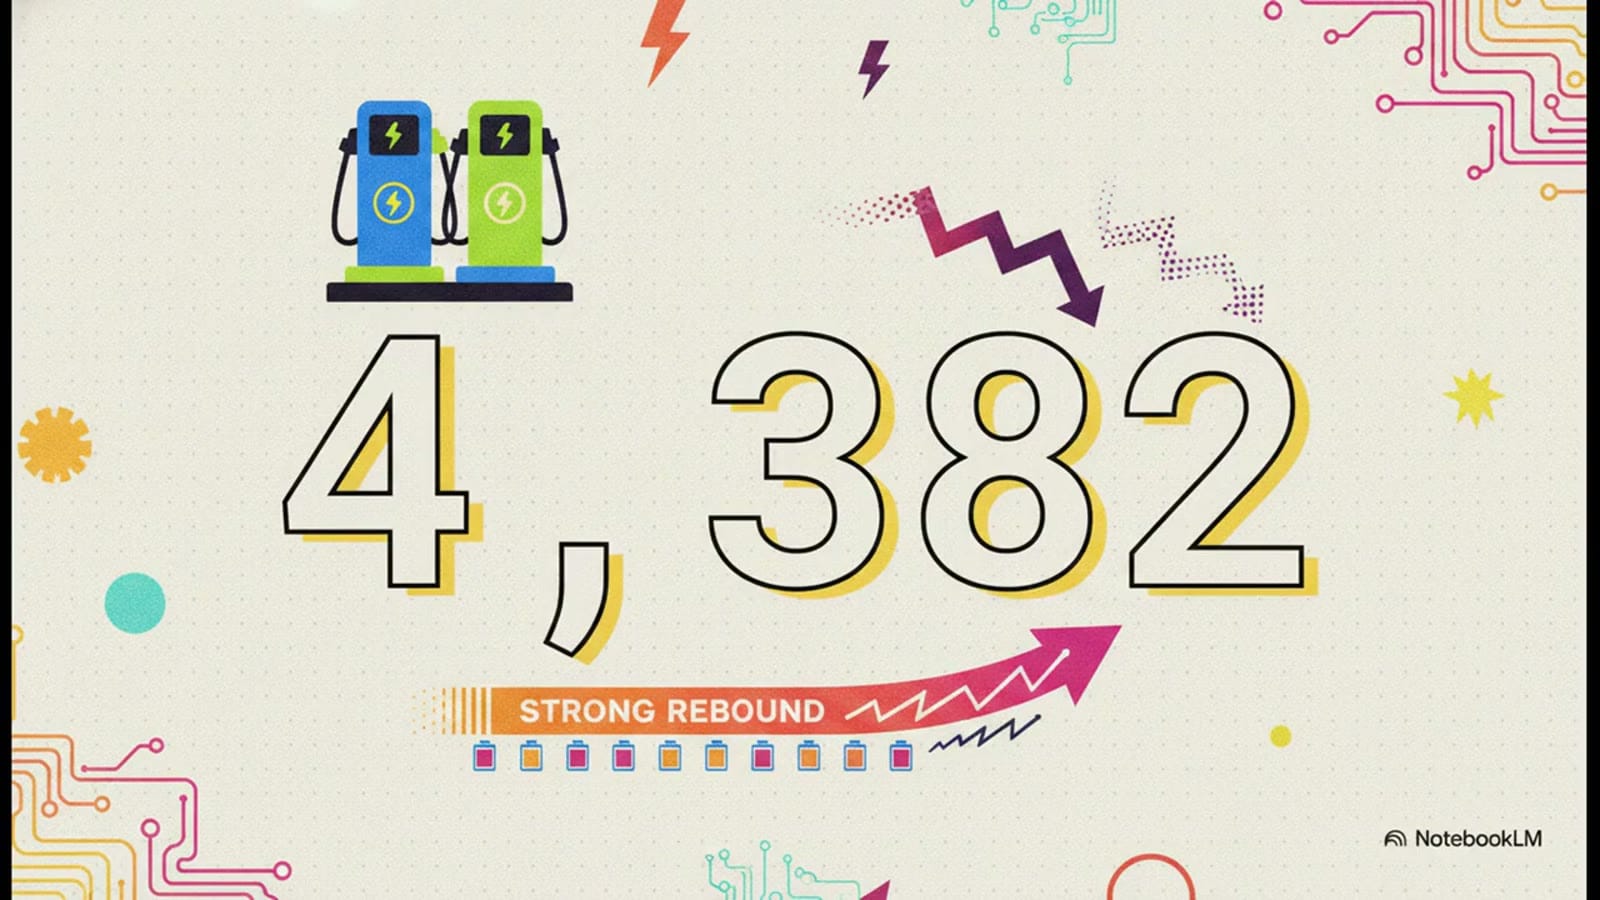
Start with the number that frames everything else. According to Paren’s Q2 2026 State of the US Fast EV Charging Industry report — which tracks more than 99% of US fast-charging infrastructure — the public DC fast-charging network reached 77,776 ports across 14,514 stations by the end of the second quarter of 2026. Operators added 4,382 new ports across 806 new stations in Q2, a healthy rebound from the seasonal Q1 low of 3,521 ports, and pushed the first-half 2026 total to 7,903 new ports.

But the pace has moderated. Q2 2026’s 4,382 ports sit about 10% below the 4,865 added in Q2 2025 and well short of the 5,966-port peak in Q4 2025. The first half of 2026 (7,903 ports) was down 7.4% from 8,532 in the same period a year earlier. This is not a collapse — it is what Paren and analysts like Loren McDonald now call “Charging 2.0”: an industry shifting its focus from sheer port count toward reliability, customer experience, and a path to profitability.
Tesla still leads, but its grip is loosening
Tesla remains the single largest builder, but the gap is narrowing in a way that would have been unthinkable three years ago. Tesla added 1,185 new ports in Q2 2026 — 27.0% of the quarter’s total — yet that is the first time its share of new builds has fallen below 50%. Its all-time installed base of 38,733 ports still represents 49.8% of the entire US DC fast-charging network, so the lead is real, just no longer total.
Tesla share of Q2 2026 new builds
Tesla share of all-time installed base
The Supercharger network itself runs roughly 3,088–3,112 stations and 37,400+ ports in the US (mid-2026 figures), with V3 hardware delivering up to 250 kW per stall and newer V4 cabinets supporting 350–500 kW for compatible vehicles. Crucially for non-Tesla drivers, more than 9,500 Supercharger stalls are now open to other brands across all 50 states via native NACS ports, Magic Dock, or adapters — turning what was once a Tesla-only perk into shared public infrastructure.
NACS vs CCS: the connector war is far from over
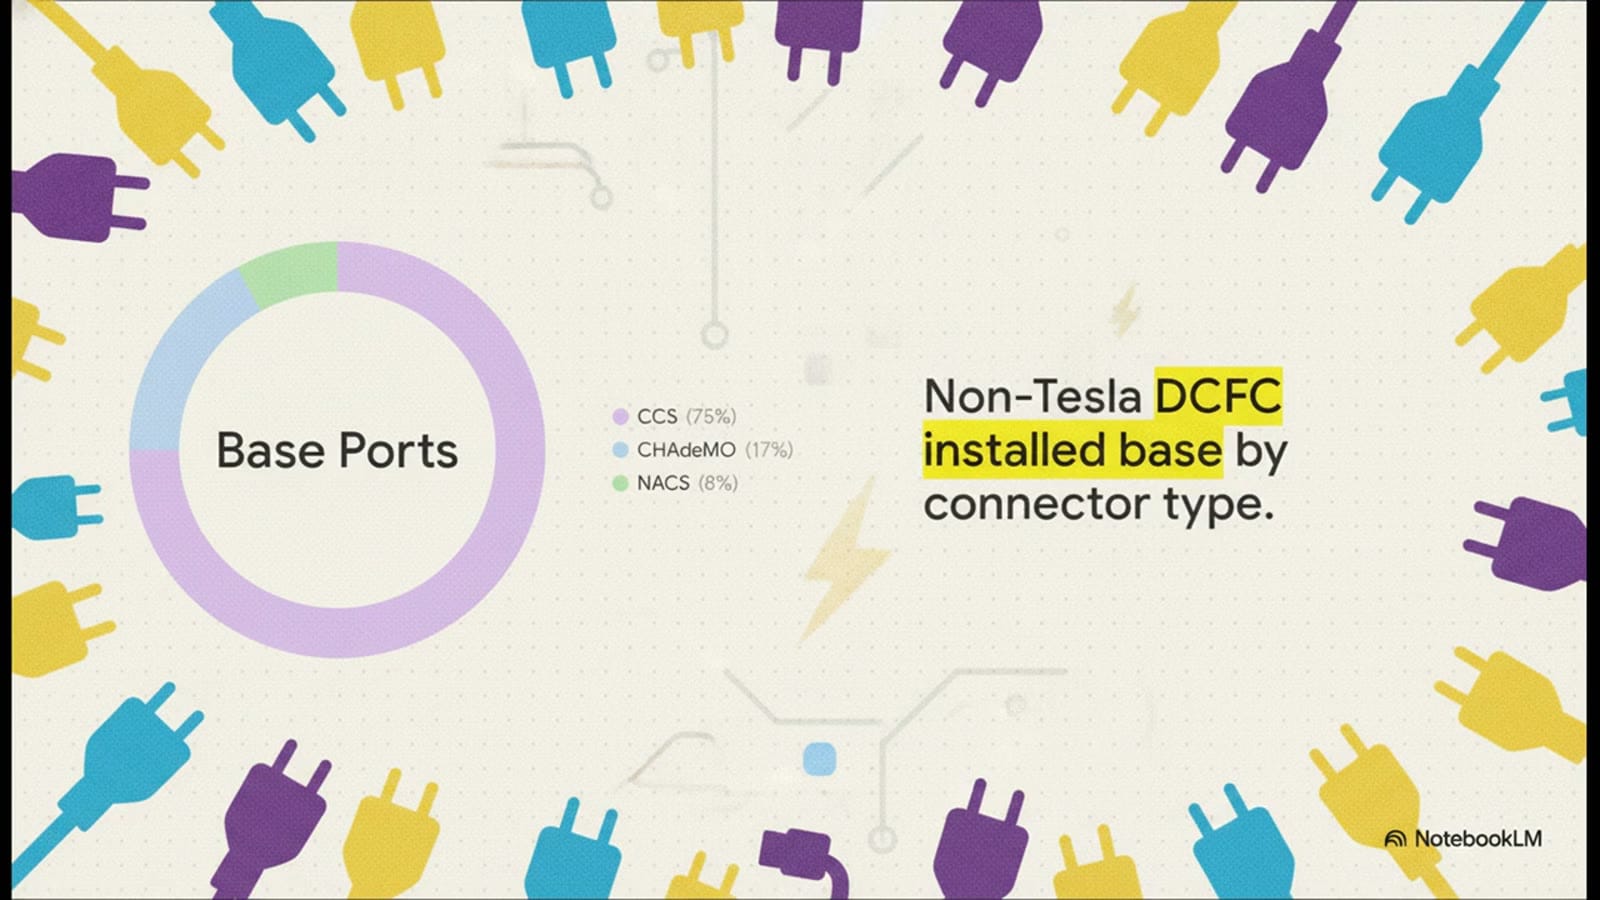
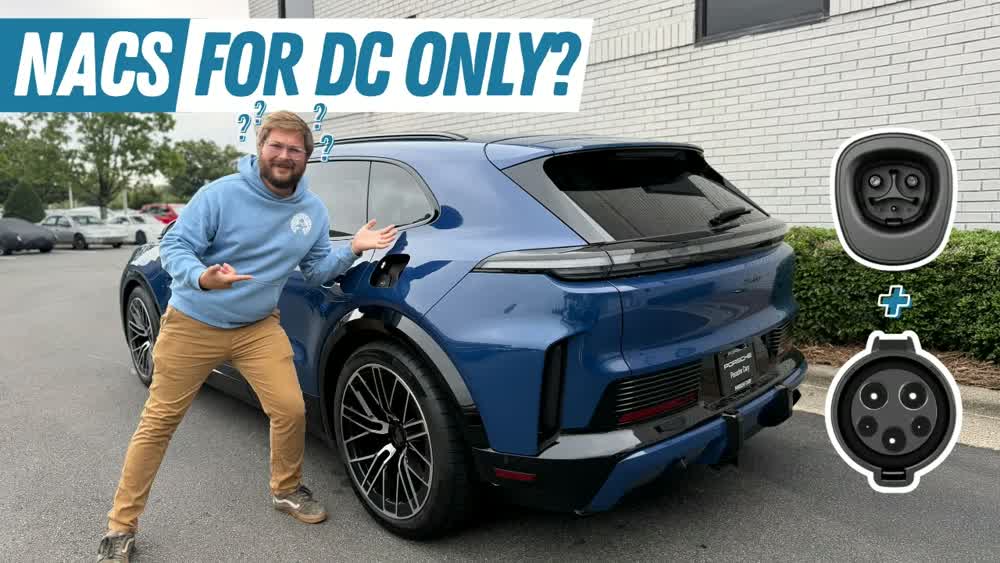
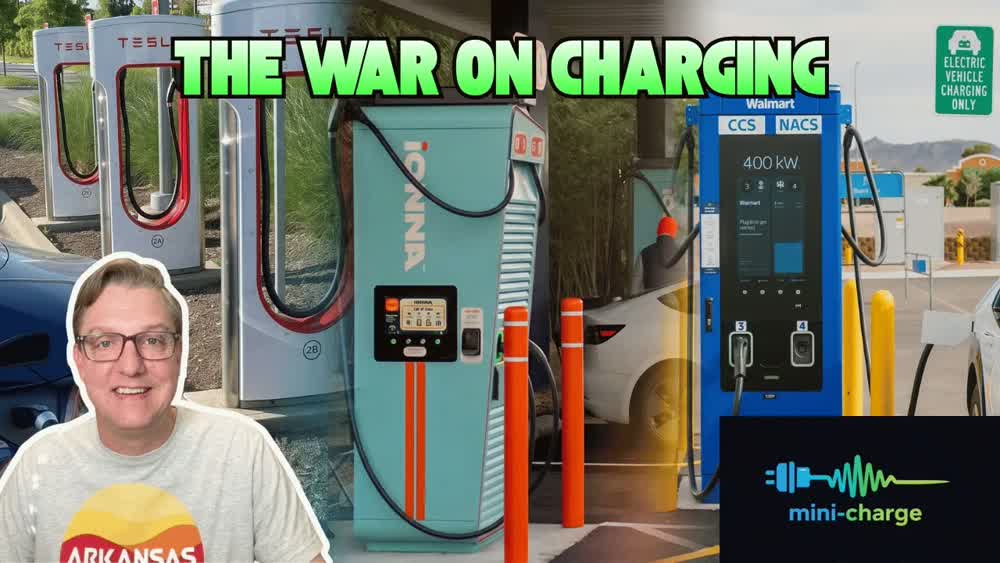
You have probably heard that “everyone switched to NACS.” The data tells a more nuanced story. Among new non-Tesla connectors in Q2 2026, NACS reached 22.9% — more than double its roughly 10% share a year earlier — while CCS still accounted for 70.8% of new non-Tesla builds. Across the entire installed non-Tesla base, CCS holds nearly three-quarters of all ports, NACS about 8%, and CHAdeMO is fading into a small remainder.
The practical takeaway: NACS is winning the future, but CCS owns the present. For the near future, mixed-connector sites and bulky adapters remain a fact of life for American EV owners. Full parity between the two standards is, by Paren’s own estimate, still years away.
Speed is now the default — 250 kW and up
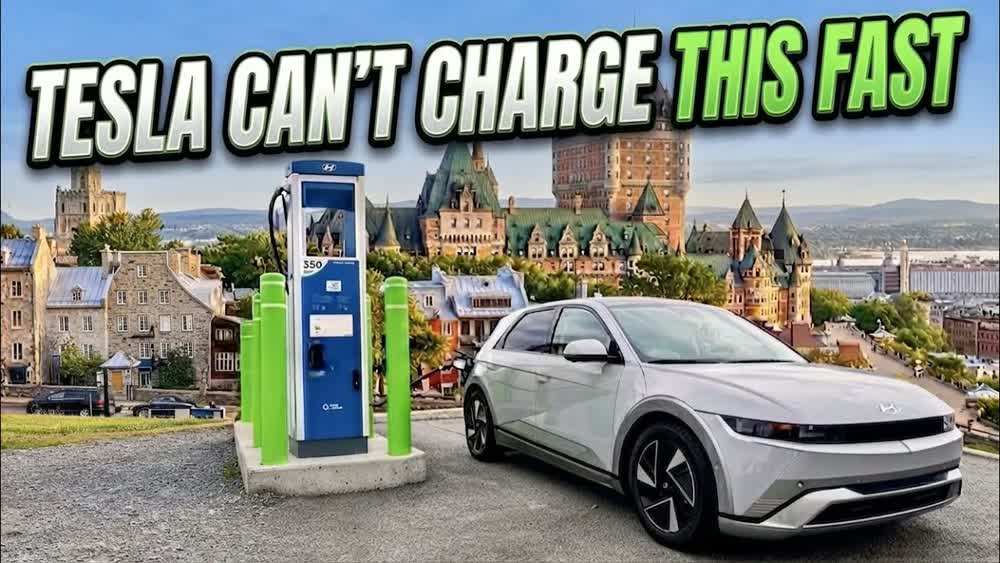
If there is one quiet revolution, it is power. Including Tesla’s deployments, about 72% of all new ports installed in Q2 2026 were rated at 250 kW or higher, and among non-Tesla operators that figure hit 62% — up from just 39% a year earlier. Ultra-fast charging has become the industry’s default for new construction.
Peak hardware now spans the networks: Tesla V4 at 350–500 kW, Electrify America and EVgo at 350 kW, and newcomers like Ionna and Mercedes-Benz HPC at 350–400 kW. For context on why raw kilowatts matter less than most buyers assume, see our breakdown of why 800-volt architecture — not range — wins the 2026 EV conversation.
Reliability and utilization: the real story
Speed only matters if the plug works. Paren’s national reliability score improved to 93.8 in Q2, and total charging sessions rose 15% quarter-over-quarter to 46.0 million. National utilization held steady at 15.76% (versus 15.64% in Q1) even as station counts grew 16.4% year-over-year — meaning demand is rising almost exactly in step with new capacity. Sessions per port climbed from 202.9 in April to 224.7 in June.
Network-by-network, the gaps are stark. Independent testing and J.D. Power data put Tesla’s session-success rate near 96–99%, Electrify America in the 80–90% range (after its “Boost” hardware-replacement program), and EVgo around 85–95%. A 150 kW charger that works beats a 350 kW charger that is offline every time — which is why reliability, not peak power, should top a road-tripper’s checklist.
What you actually pay — and where federal money fits
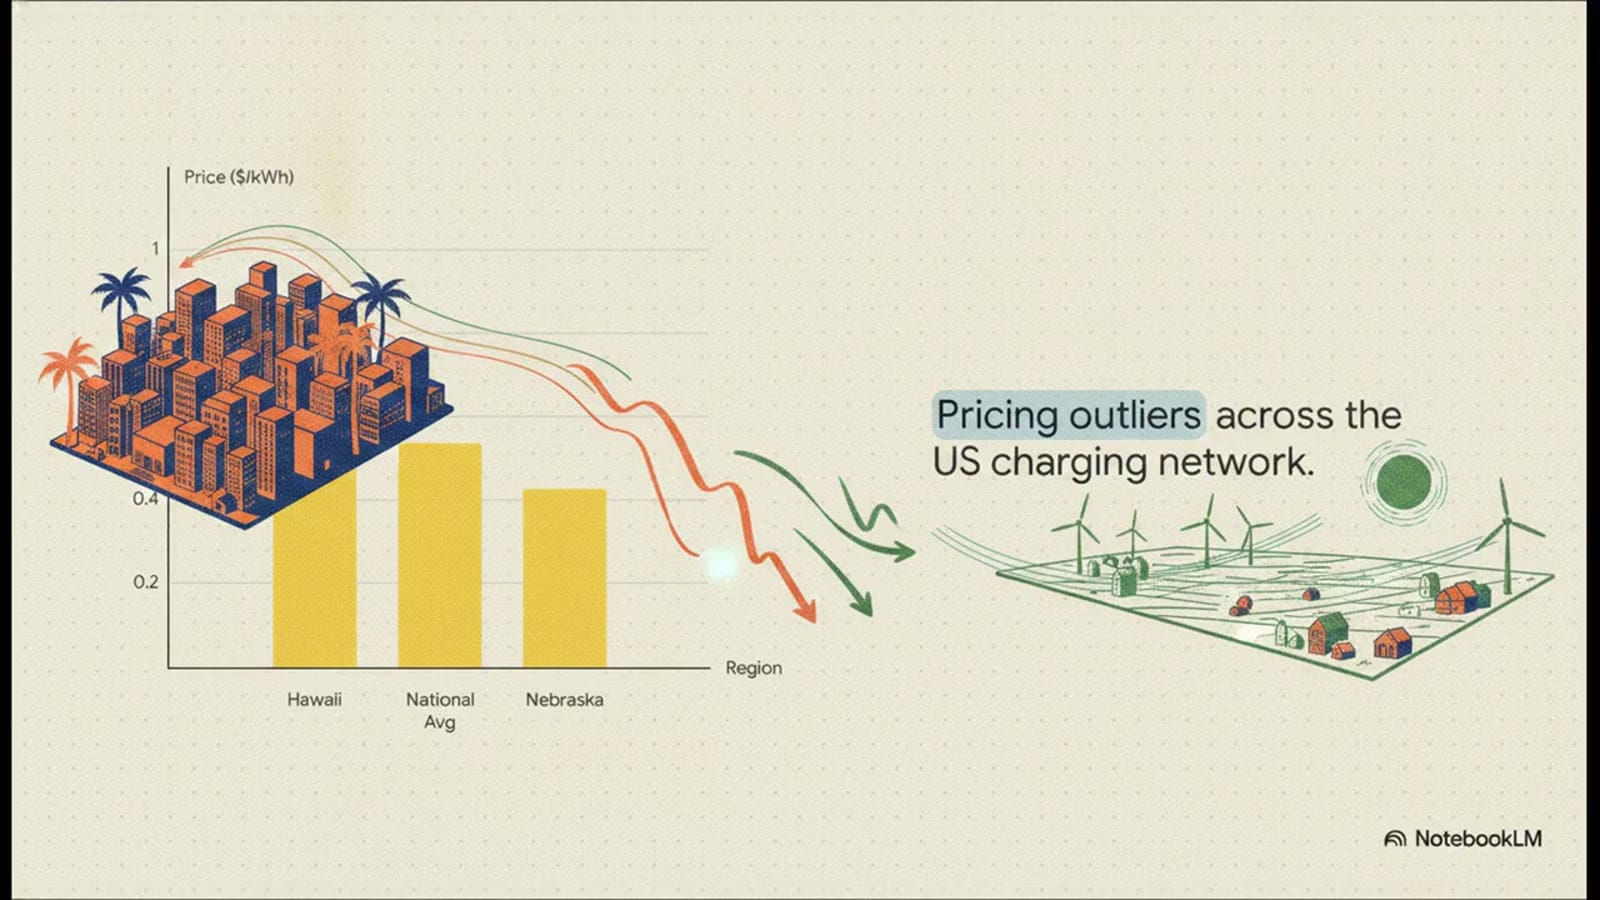
Pricing is wildly regional because it tracks local power costs and competition. The state-level average fast-charge price sat near $0.538 per kWh in Q2, but Hawaii hit $0.856/kWh while Nebraska came in at just $0.428/kWh. Where you live dramatically changes what you pay.
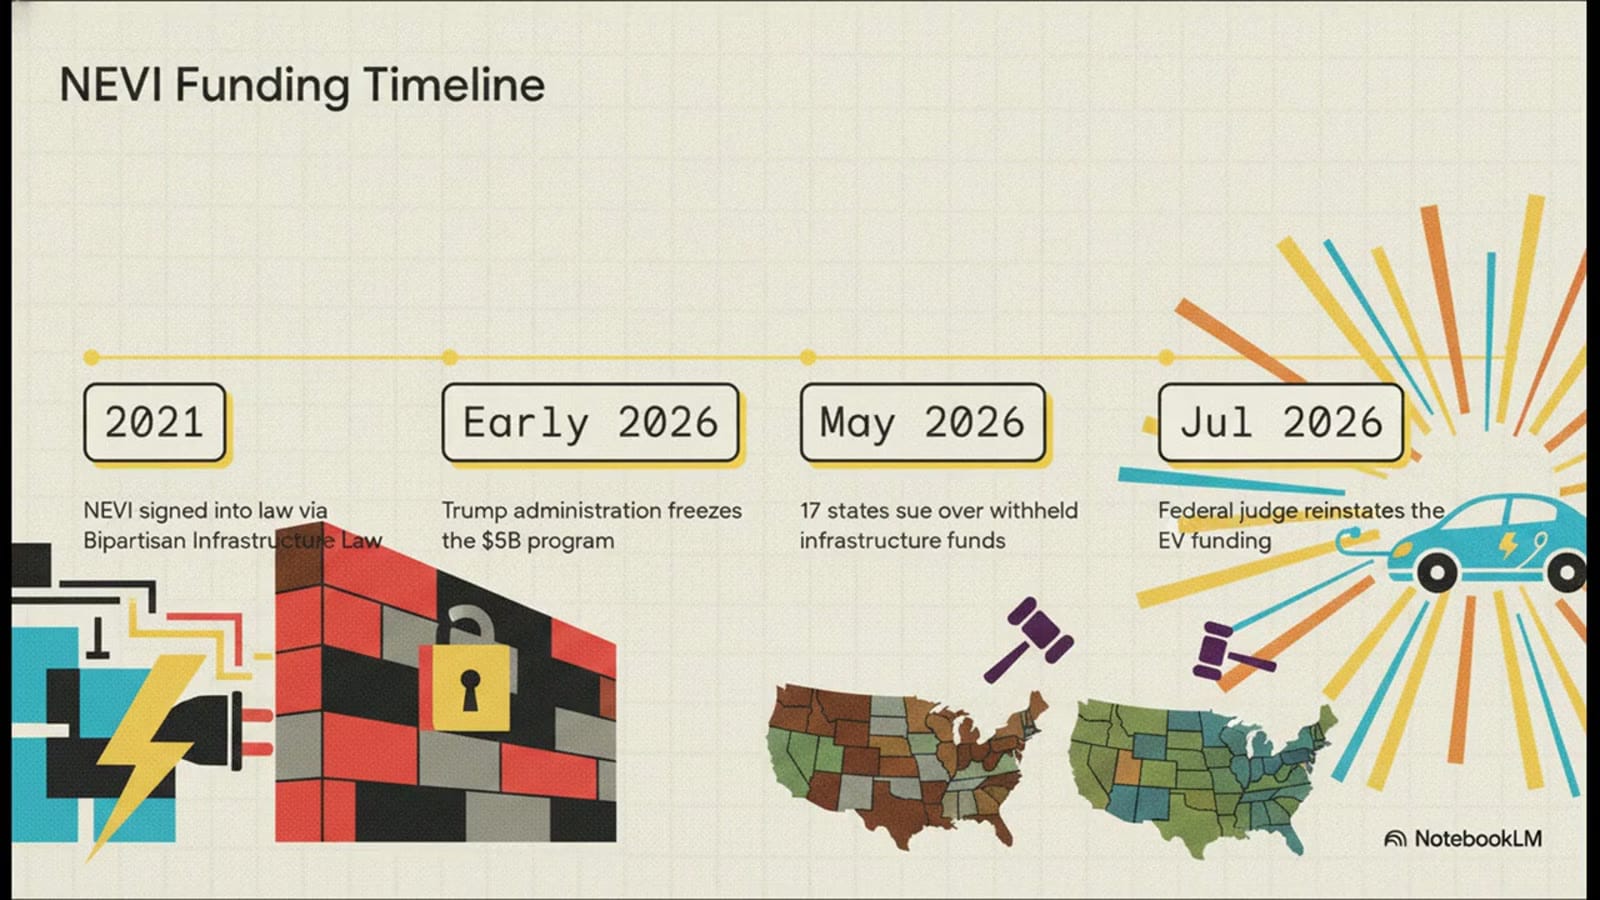
Federal support, meanwhile, has been surprisingly small. The $5 billion NEVI Formula Program, created by the 2021 Infrastructure Investment and Jobs Act, was frozen after a January 2025 executive order. A coalition of states — originally 17, later 20 plus the District of Columbia — sued, and on January 23, 2026, U.S. District Judge Tana Lin (Western District of Washington) issued a summary judgment permanently barring DOT from withholding the funds, finding the freeze arbitrary and capricious under the Administrative Procedure Act. Yet as of February 2026, fewer than 1,000 NEVI-funded ports were operational — roughly 3% of 2025’s DC additions. Private capital, led by Tesla, built the other 97%.
The bottom line for US drivers
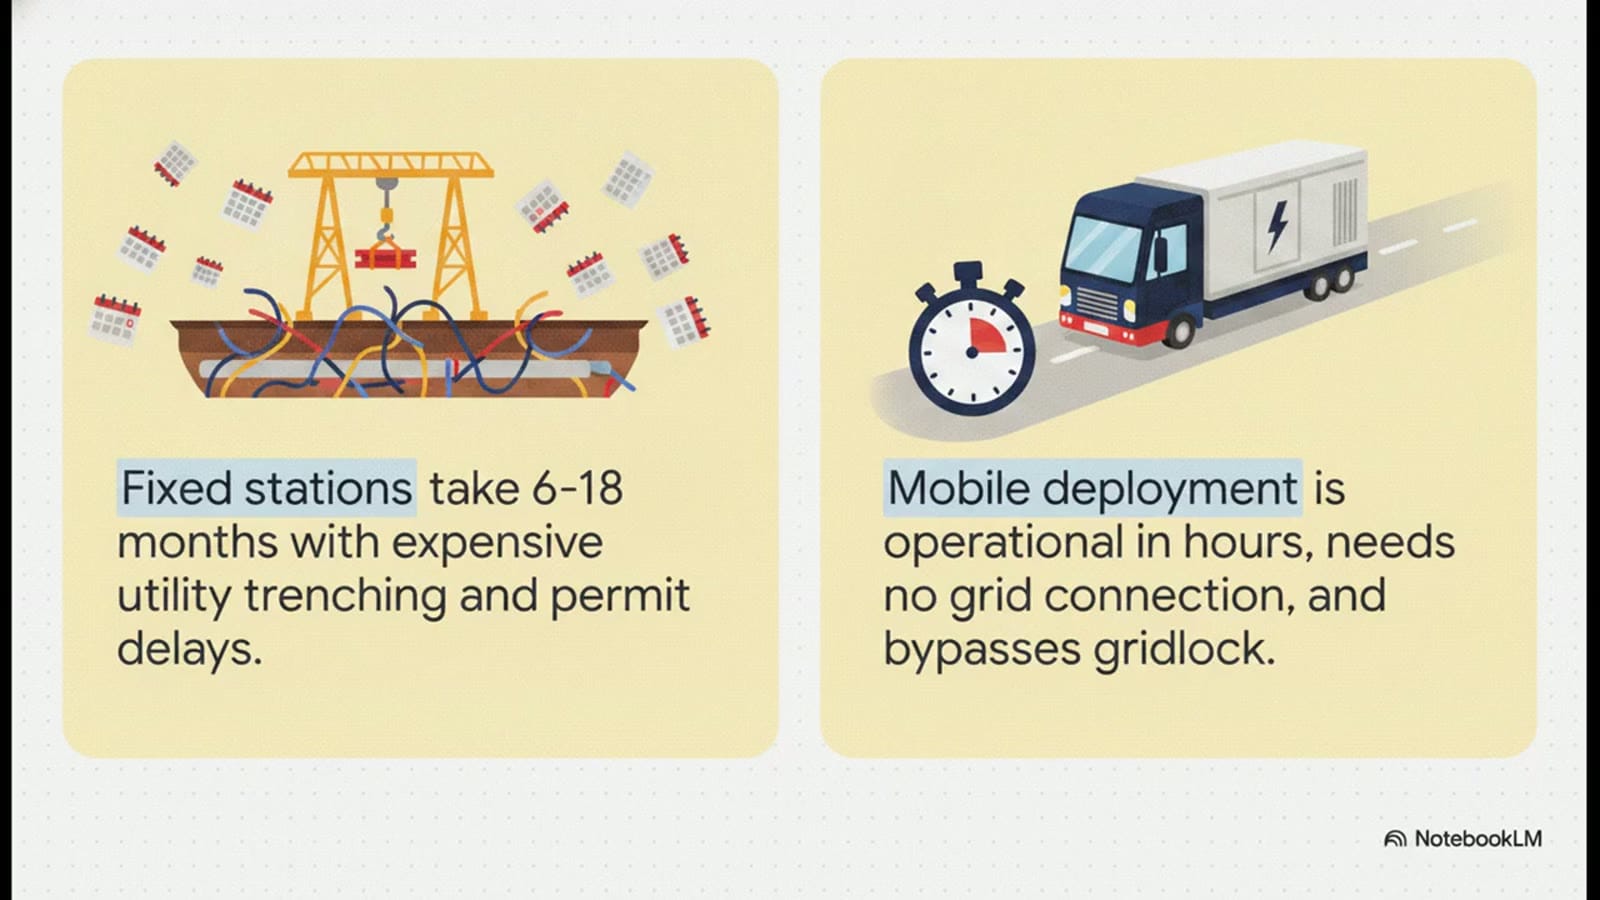
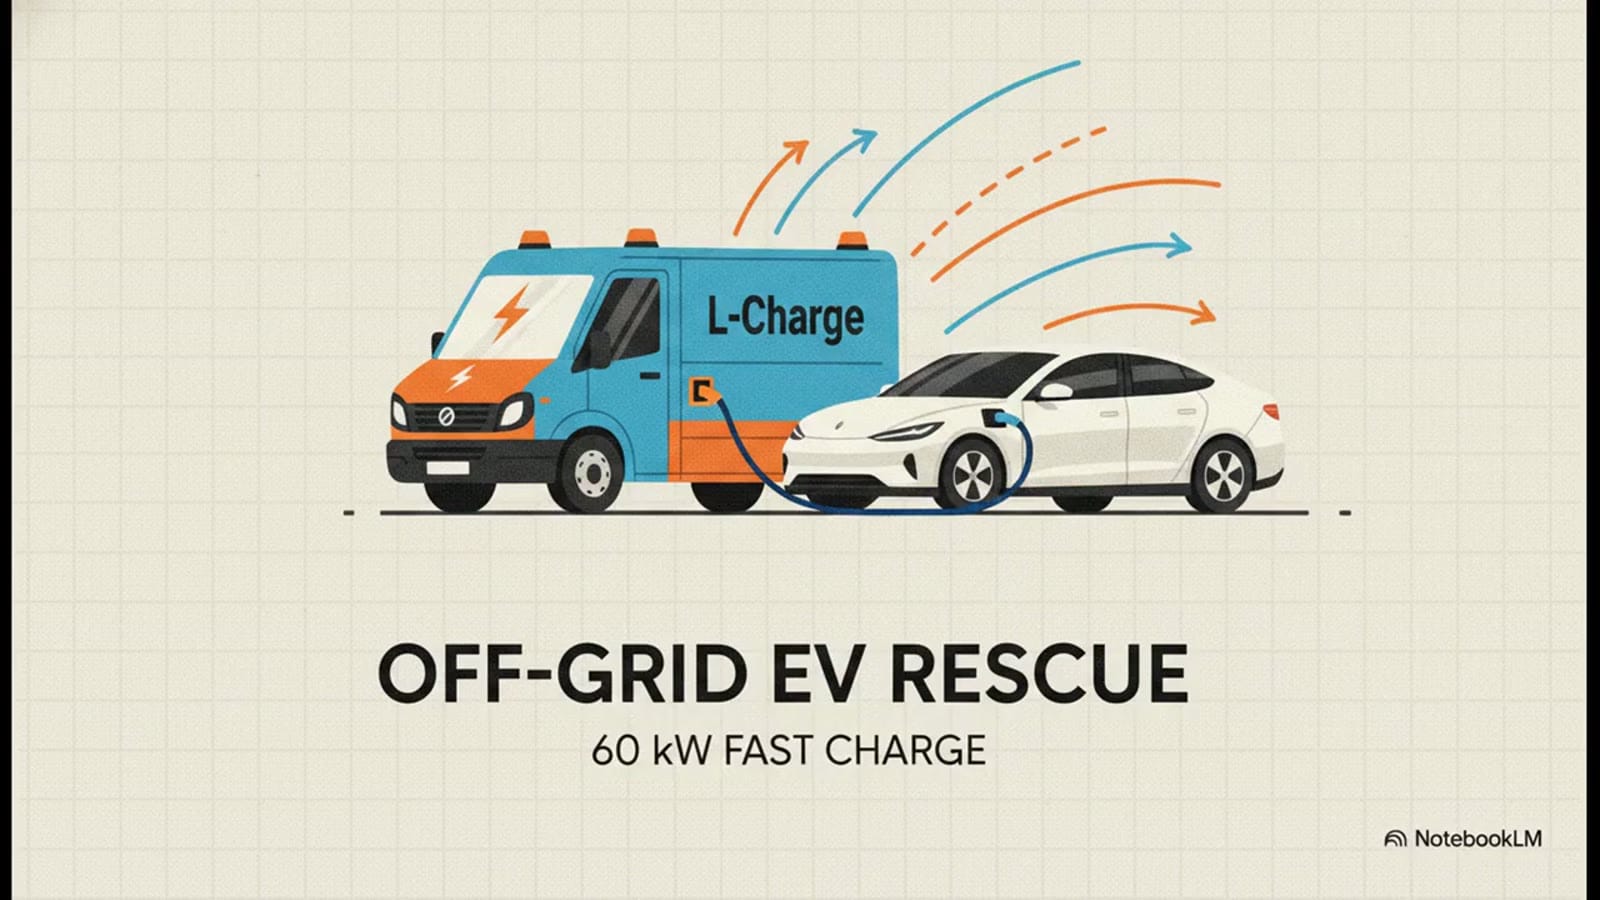
The 2026 landscape is a tale of two layers. The fixed network — now 77,776 fast ports and growing — is reliable enough for confident road trips on Tesla, and increasingly viable on Electrify America and EVgo if you plan around uptime. The connector split (NACS rising, CCS dominant) means adapters still travel with most cars. And a third layer is emerging offshore from the grid entirely: mobile and off-grid solutions like EV Safe Charge’s robotic “Ziggy” charger, Exos Hub’s towable 210–630 kWh storage units, and Lcharge’s 60 kW roadside rescue vehicles are bypassing utility trenching to go live in days, not the 6–18 months a fixed station can take.
For most American owners the advice is simple: charge at home whenever you can, lean on the Supercharger network for cross-country trips, and treat a non-Tesla fast-charge stop as a planned 30-minute buffer rather than a five-minute splash. If you drive a newer NACS-native vehicle, our report on the Rivian R2 NACS adapter charging failure shows why even “plug-and-charge” promises deserve a real-world test.
Do I need a NACS adapter to use a Tesla Supercharger?
Not always. Most 2024-and-newer EVs from Ford, GM, Rivian, Hyundai, and others ship with native NACS ports and plug in directly. Older CCS vehicles need either a NACS adapter or must use a “Magic Dock” Supercharger site, which has a built-in CCS connector. The Tesla app shows which stalls near you are open to non-Tesla EVs.
Is Electrify America reliable enough for a 2026 road trip?
Mostly, with planning. EA operates 350 kW hardware on major corridors and its “Boost” program has lifted uptime into the 80–90% range, but that still trails Tesla’s ~96–99%. On a long trip, identify backup stations and avoid relying on a single EA site, especially in rural stretches.
Why does charging cost so much more in some states?
Prices track local electricity rates and competition. Dense, constrained markets like Hawaii (about $0.86/kWh) pay far more than lower-density plains states like Nebraska (about $0.43/kWh), where simpler fixed pricing keeps rates close to the actual cost of power. Some states also mandate per-minute billing, which changes the math versus per-kWh.
Sources: Paren, Q2 2026 State of the US Fast EV Charging Industry Report (77,776 ports / 14,514 stations; 4,382 Q2 new ports; Tesla 27.0% of new builds, 49.8% all-time; NACS 22.9% of new non-Tesla connectors; 72% of new ports ≥250 kW; reliability 93.8; utilization 15.76%; $0.538/kWh national average) — reported via EVwire and EV Infrastructure News. Tesla Supercharger station/port counts and non-Tesla access via evbattery.us and industry tracking (mid-2026). Network reliability and speed comparisons via J.D. Power EV Experience Index, PlugShare, and independent 2026 network testing (Tesla ~96–99%, Electrify America 80–90%, EVgo 85–95%). NEVI program and litigation: U.S. District Court, Western District of Washington, State of Washington v. U.S. Department of Transportation, summary judgment Jan 23, 2026 (Judge Tana Lin); IIJA 2021; NEVI-funded port count via industry analysis (Feb 2026).