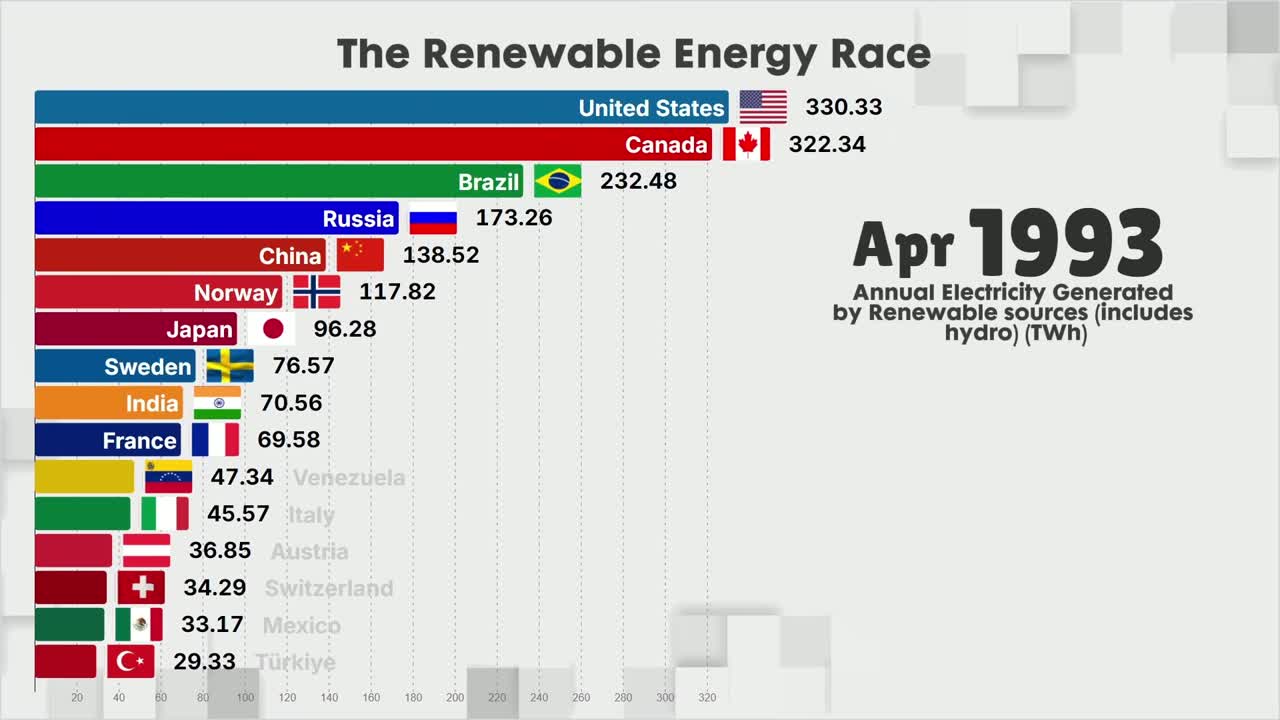
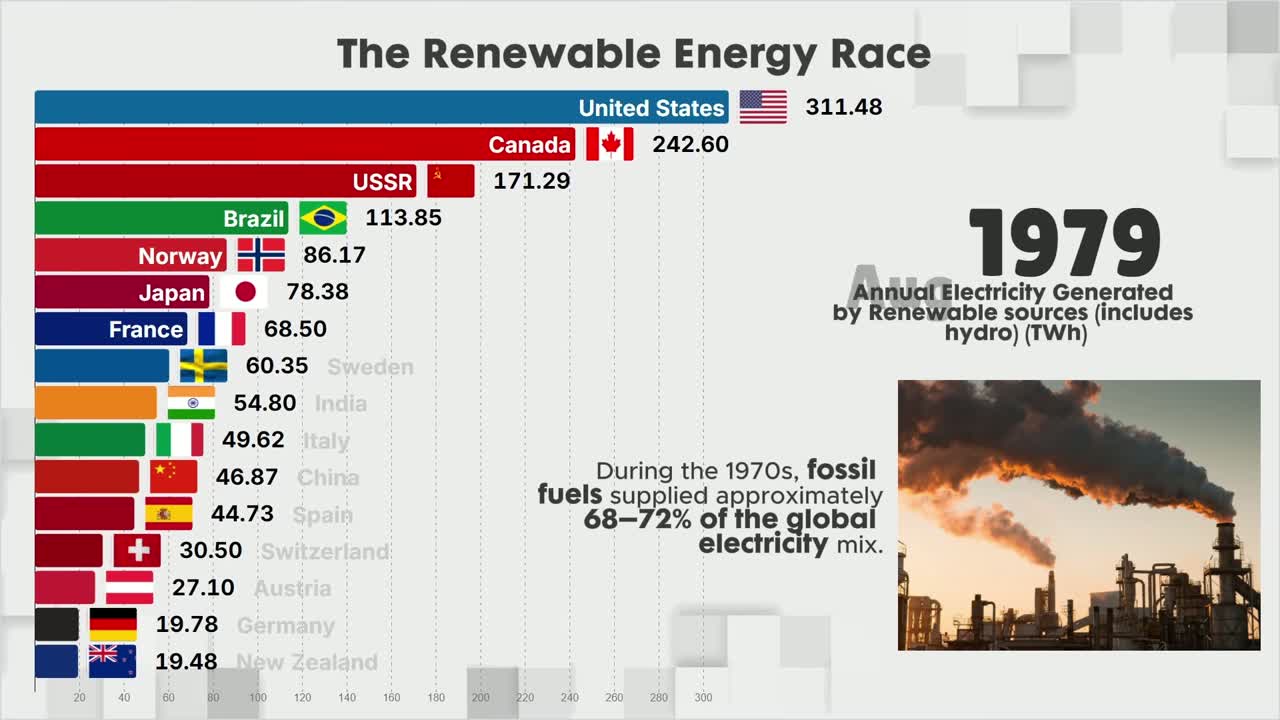
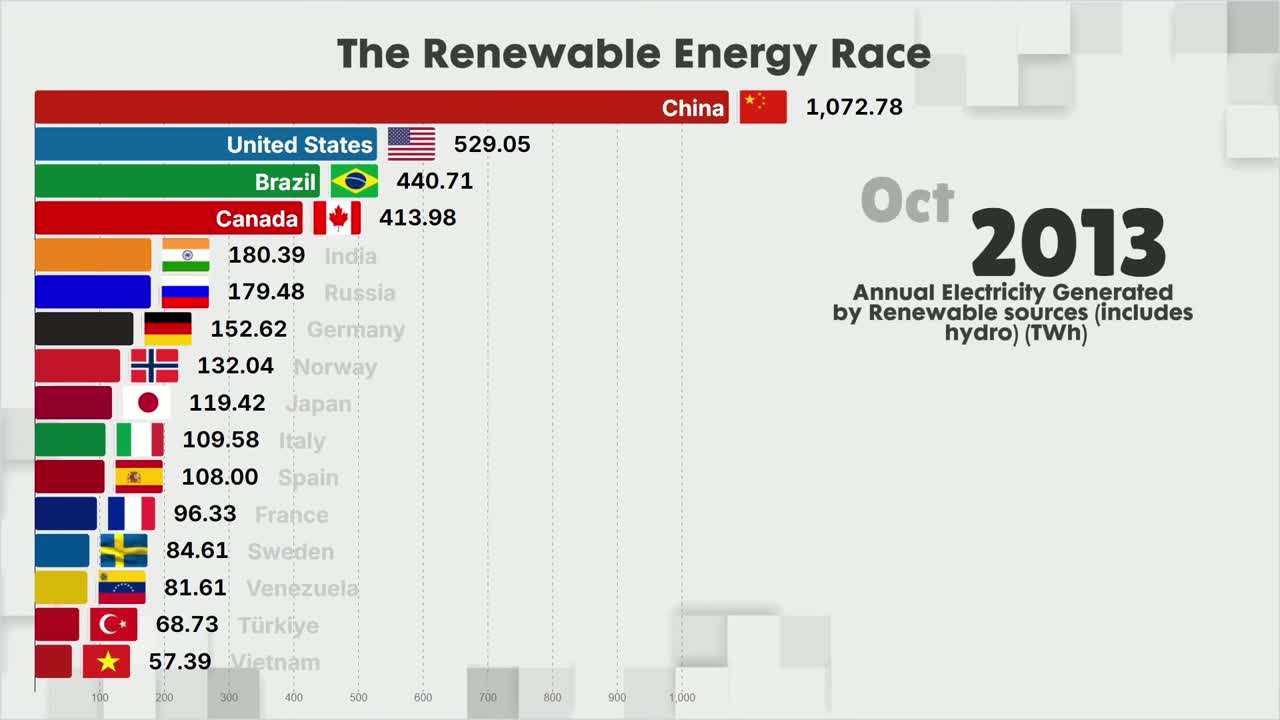
The world has spent 60 years switching energy sources, and the pattern is clear: the cheapest option wins. For American EV buyers, that history is the strongest signal yet that electric driving is not a fad — it is the next stage of the same race.
Watch the source data visualization
From coal and oil to gas and nuclear (1960–1985)
For most of the 20th century, electricity was a fossil story. In 1960, coal supplied about 37% of the world’s primary energy mix, oil about 27%, and natural gas just 11%, according to data compiled by Our World in Data and historian Vaclav Smil. Oil’s share then climbed steeply as the postwar auto boom and the spread of oil-fired power plants took hold — by 1970 oil had passed coal at roughly 40% of the mix, while coal had fallen to about 26%.
The two oil shocks of the 1970s changed the map. Utilities that had bet on oil suddenly looked exposed, and nuclear looked like the answer. Global nuclear generation rose from roughly 5% of world electricity in 1960 to about 12% by 1970 and peaked near 25% by 1980, based on historical electricity-mix reconstructions. The United States, France, the USSR, and the UK led that wave. But public confidence cracked after Three Mile Island in 1979 and Chernobyl in 1986, and nuclear orders collapsed. New reactor builds in the West have never fully recovered — which is the first lesson of the race: a technology can lead for a decade and then stall for political, not technical, reasons.

The wind-and-solar cost crash changed everything
Nuclear stalled, but a different technology was about to do what nuclear never could: get cheap fast. The numbers from the International Renewable Energy Agency’s (IRENA) 2024 cost report are the single most important fact in this whole story. Utility-scale solar’s levelized cost of electricity (LCOE) fell 90% between 2010 and 2024 — from $0.417 per kWh to just $0.043. Onshore wind is now the cheapest renewable at $0.034/kWh. Solar’s total installed cost dropped 87%, from $5,283 per kW in 2010 to $691 in 2024.
Batteries are the quiet hero of the same curve. Utility-scale battery storage costs fell 93% since 2010, reaching about $192/kWh in 2024. That is what lets a solar farm keep supplying power after sunset and what turns an EV into a rolling storage unit. IRENA found that 91% of newly commissioned utility-scale renewable capacity in 2024 was cheaper than the cheapest new fossil alternative, and the 582 GW of new renewables added that year avoided $467 billion in global fossil-fuel costs.
| Technology | LCOE 2010 | LCOE 2024 | Cost drop |
|---|
| Solar PV (utility-scale) | $0.417/kWh | $0.043/kWh | 90% |
| Onshore wind | ~$0.085/kWh | $0.034/kWh | ~60% |
| Battery storage (installed) | $2,571/kWh | $192/kWh | 93% |
Source: IRENA, Renewable Power Generation Costs in 2024.
Who led each stage — and why China owns the next one
Every stage of the energy race had a leader. The US and Europe built the coal-and-oil grid; the US and France built the nuclear fleet; Germany and Denmark pioneered wind; and today China owns the manufacturing backbone of the renewable era. BloombergNEF’s Energy Transition Supply Chains 2025 report found that China absorbed 76% of global clean-tech factory investment in 2024 and controls more than 70% of manufacturing capacity in every major segment except hydrogen electrolyzers.
In solar specifically, China held over 80% of global polysilicon, wafer, cell, and module capacity in 2024, with the IEA putting its share of wafers at 78%, cells at 87%, and polysilicon at 97%. In batteries, SNE Research reported in late 2025 that Chinese firms made up six of the world’s ten largest battery makers and about 69% of the global market. This matters to an American buyer because it is exactly why EV and home-battery prices keep falling — the hardware is made on the cheapest production line on Earth. As we detailed in our look at how China dominates the global EV factory boom, that dominance is now the central fact shaping US EV pricing.
China’s share of global solar manufacturing capacity (2024)

What this means for the US grid — and your EV
The US grid is cleaner than the global average in some ways and dirtier in others. According to the EIA, the US generated 4,155 billion kWh in 2024. Natural gas was the top source at about 42%, coal about 16%, renewables about 23% (the second-largest contributor), and nuclear about 19%. The trend is moving the right way: EIA expects renewables to reach about 24% in 2025 and 26% in 2026, while coal keeps retiring — roughly 11 GW of coal capacity comes offline in 2025 alone.
Why should an EV buyer care? Because the “is an EV really clean?” question is really a “what’s on the grid?” question. A car charged on a 42%-gas, 16%-coal mix is cleaner than a gasoline car but not zero. As renewables climb past a quarter of US generation and battery storage spreads, the same miles get cleaner every year you own the car. That is a feature no gasoline vehicle can match. For the math on whether that pencils out for you, see our breakdown of whether electric cars are worth it in 2026.
| US source | 2024 share | 2025 (proj.) | 2026 (proj.) |
|---|
| Natural gas | 42% | 40% | 40% |
| Coal | 16% | 17% | 16% |
| Renewables | 23% | 24% | 26% |
| Nuclear | 19% | 18% | 18% |
Source: U.S. Energy Information Administration, Short-Term Energy Outlook.
The battery-storage wave that makes it stick
Cheap solar and wind solved the generation problem; storage solves the “but the sun doesn’t always shine” problem. BloombergNEF reports that global energy-storage deployments crossed 100 GW for the first time in 2025, hitting 112 GW / 307 GWh — a 48% jump from 2024 — with cumulative capacity (excluding pumped hydro) reaching roughly 2.9 TW. China accounted for 54% of additions and the US 16%. BNEF forecasts 158 GW in 2026.
For American drivers this is the link between the grid and the garage. Home battery systems let solar owners ride through outages; vehicle-to-grid (V2G) standards like NACS open the door to EVs feeding power back at peak; and falling storage costs are what make utility-scale renewables reliable enough to retire coal. The storage curve is following the same playbook that flattened solar costs — and it is why the recent “EV is dead” narrative collapses under the actual US numbers.
2025 global battery-storage growth vs 2024
Six decades, one lesson for EV buyers
Look back at 1960, 1980, and 2026 and the throughline is the same: energy transitions are slow, then sudden, and the winner is always the option that gets cheap enough to be obvious. Coal lost to oil, oil lost to gas and nuclear in places, and now gas and coal are losing to wind, solar, and storage because the new options crossed the cost line. The IEA expects renewables to overtake coal as the world’s largest electricity source “by 2026 at the latest” — the first time in roughly a century that coal’s share falls below a third — with wind and solar jumping from 4% of global generation in 2015 to nearly 20% in 2026.
EVs are riding that exact wave. They are not waiting for a future breakthrough; they are being pulled forward by the same manufacturing scale, the same battery cost crash, and the same cleaner grid that just reshaped global power. The $7,500 federal tax credit expired on September 30, 2025, so the purchase decision now leans harder on falling hardware prices and cheap home charging — both direct products of the race you just read about. Six decades of energy history say the direction is set. The only real question for a US buyer is timing, and the cost curves say the clock is already running.
Is an EV actually cleaner if my local grid still burns coal?
Yes, and it gets cleaner every year. The EIA puts US coal at about 16% of generation in 2024 and falling, with renewables near 23% and rising toward 26% by 2026. Even on today’s mix, an average EV produces far lower well-to-wheel emissions than a gasoline car, and because the grid keeps greening, the same EV’s lifetime footprint shrinks the longer you own it.
Why did nuclear stall after leading in the 1980s?
Nuclear reached about a quarter of world electricity by 1980, but the Three Mile Island (1979) and Chernobyl (1986) accidents shattered public confidence, lengthened approvals, and killed new orders in the West. It is a reminder that transitions can stall for political and social reasons even when the technology works.
Does China’s dominance hurt or help US EV buyers?
Mostly it helps your wallet. Chinese control of 80%+ of solar and battery supply chains is the main reason module and battery prices have fallen so far, which lowers both EV sticker prices and home-energy costs. The trade-off is strategic dependency, which is why US policy is pushing onshoring — but those subsidies take years to move prices, while today’s buyers benefit from the cheap hardware immediately.
Sources: IRENA, Renewable Power Generation Costs in 2024 (solar/wind/battery LCOE and cost declines); International Energy Agency, Electricity Mid-Year Update 2025 (renewables overtaking coal, wind+solar share); BloombergNEF, Energy Transition Supply Chains 2025 and Energy Storage Market Outlook 1H 2026 (China manufacturing share, storage deployments); U.S. Energy Information Administration, Short-Term Energy Outlook (US generation mix); Our World in Data / V. Smil historical energy-mix series; SNE Research (global battery market share, Oct 2025).