Tesla reports second-quarter 2026 results after the bell on July 22, and the delivery headline is already known: 480,126 vehicles, a blowout 18% above the sell-side consensus. The question for investors is whether the profit beneath that number justifies the stock’s premium.
The delivery beat is already in the books
Tesla published its Q2 production and delivery report on July 2, so the volume figure is settled before the earnings call. The company delivered 480,126 vehicles in the quarter, up about 25% year over year and 34% from Q1, on production of 451,758 units. Model 3 and Model Y accounted for 467,762 of those deliveries — roughly 97.4% of the mix — while the “other models” bucket, including Cybertruck and the S/X, contributed just 12,364. The result crushed the Tesla-compiled sell-side consensus of 406,024 by about 18.3%, making it one of the largest delivery surprises in the company’s recent history.
What is interesting is how the market reacted. Despite the beat, shares fell roughly 7% on the delivery announcement — their worst single-day drop in about a year. The Street has stopped rewarding Tesla for unit volume alone; with the federal $7,500 EV credit gone as of September 30, 2025, the beat was powered more by China and Europe than a softer US market, setting up the real drama around profitability, not cars sold.

Automotive gross margin is the metric that moves the stock
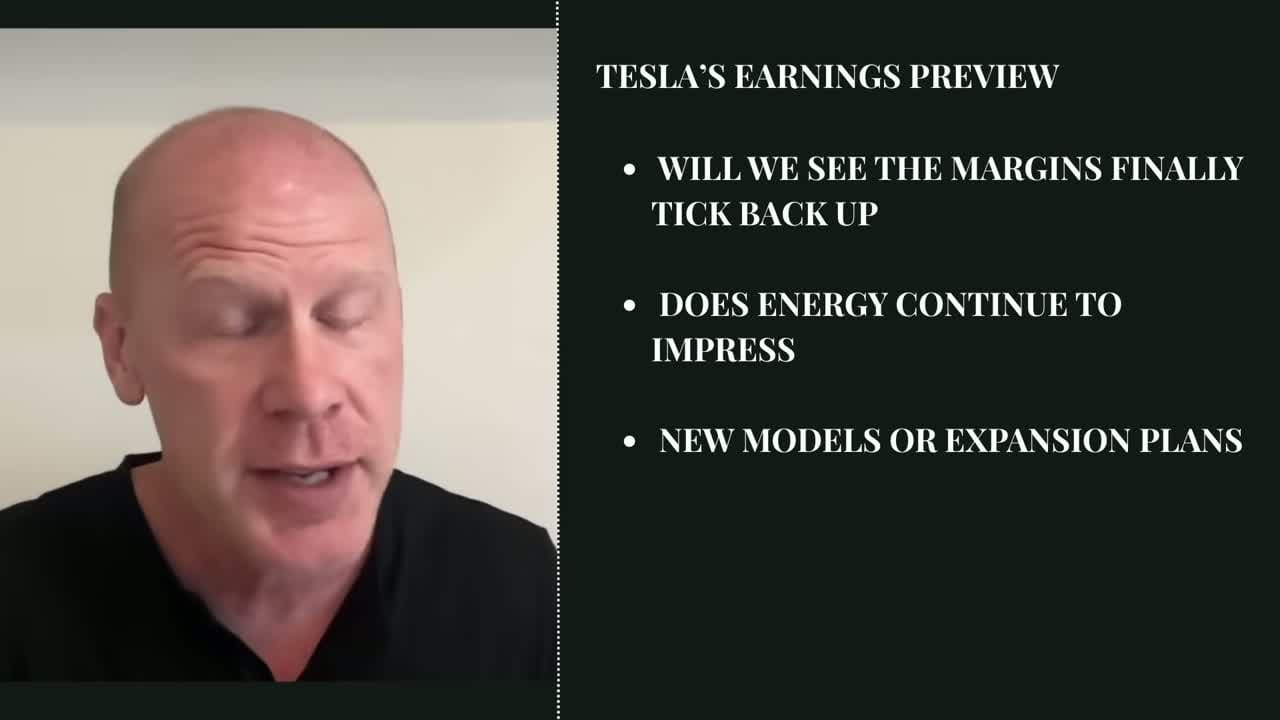
If there is one line item to watch, it is automotive gross margin excluding regulatory credits. This strips out the low-cost “free money” Tesla earns selling emissions credits to legacy automakers, exposing the profitability of actually building and selling cars. In Q1 2026 that figure recovered to 19.2%, a sharp rebound from 12.5% a year earlier. For Q2, the consensus cluster sits in the 18%–20% range.
The threshold matters. A print above 20% would validate the bull thesis that the delivery beat came from genuine demand at sustainable prices. A fall below 18% would confirm the bear fear that volume was purchased with price cuts that erode profitability. Mix is a headwind: with Model 3/Y at 97% of deliveries, average selling price is being pulled toward roughly $42,500–$44,500, down from about $45,300 in Q1, helped lower by the Cybertruck Cyberbeast’s $15,000 price cut to $99,990 even as some Model Y trims rose $1,000 in May.
Q2 auto GM ex-credits consensus~18–20%
Energy storage is quietly becoming the profit engine
While the auto story gets the headlines, energy storage is where the margin quality lives. Tesla deployed 13.5 GWh of storage in Q2, up 53% from 8.8 GWh in Q1 and about 40% year over year. In Q1 the segment posted $2.408 billion in revenue at a 39.5% gross margin, up from 28.8% a year earlier, and contributed about 13% of company revenue but roughly 23% of profit. Analyst views on near-term storage margin differ, but the strategic direction is clear.
Capacity is scaling to match. Tesla plans to begin Megapack 3 production at its new Houston factory by the end of 2026, with a line rated up to 50 GWh per year, on top of its already maxed Lathrop and Shanghai plants. With AI-data-center demand pulling grid-scale storage forward, energy is the segment most likely to steady profits while the longer-shot robotics and robotaxi bets absorb capital.
The regulatory-credit cliff
This is the silent risk in the numbers. Regulatory credits — essentially free margin, since Tesla incurs almost no cost to produce them — were about 16% of gross profit in prior years. In Q1 2026, credit revenue was $380 million, down 36% year over year. The policy ground is shifting fast: the Trump administration eliminated fines for automakers that miss Corporate Average Fuel Economy (CAFE) standards, which William Blair estimates underpin about three-quarters of Tesla’s credit revenue. The firm slashed its 2025 credit estimate by nearly 40% to roughly $1.5 billion and now expects just $595 million in 2026, falling to zero by 2027. A Visible Alpha poll of 14 analysts sees 2026 credit revenue down about 21% to $2.17 billion.
Either way the trend points one direction. Combined with the lost $7,500 consumer credit, Tesla’s US profit cushion is thinning, and that is exactly why ex-credit auto margin carries so much weight this quarter. For the full buy-now-or-wait context on Tesla’s core models, our 2026 Model Y and Model 3 changes breakdown digs into what is actually new.
Regulatory-credit revenue trajectory~$1.5B ’25 → ~$0.6B ’26
Where the $25 billion capex is going
Tesla raised its full-year 2026 capital expenditure guidance to $25 billion, up from a prior $20 billion target, as CFO Vaibhav Taneja flagged negative free cash flow for the rest of the year. The money is earmarked for AI compute infrastructure, the Cybercab robotaxi line, Optimus robot production, and battery equipment. Cybercab production began around April 2026, and unsupervised robotaxi service is live in Austin with Houston and Dallas added; Morgan Stanley expects a fleet of roughly 1,500 vehicles by year-end and sees the service reaching about a dozen US states. Optimus is targeted to start production by late 2026 with a long-term goal of one million units a year.
The analytical tension is timing. These are multi-year paybacks on capital being spent now, and the company has repeatedly pushed out near-term monetization. For a US EV buyer, the practical read is that Tesla is betting its valuation on robotaxi and robotics optionality while the legacy auto business funds the experiment. The competitive field is shifting fast — our 2026 US EV shakeup coverage tracks how rivals are repositioning.
What the Street expects
Because Tesla publishes its own compiled consensus, estimates are unusually dispersed. Revenue expectations range from about $24.6 billion to $27.6 billion, and non-GAAP EPS estimates run from roughly $0.44 to $0.55, with GAAP EPS near $0.27. For context, Q1 2026 actuals were $22.39 billion in revenue and $0.41 non-GAAP EPS, while Q2 2025 posted $22.50 billion in revenue and $0.40 GAAP EPS. The dispersion itself is the signal: with shares near $380 and a consensus 12-month target around $460, the bar for a positive reaction is high and the options market is pricing about an 8% post-earnings move.
| Metric | Q2 2025 (actual) | Q1 2026 (actual) | Q2 2026 (expectation) |
|---|
| Deliveries | ~444,000 | 358,000 | 480,126 (reported) |
| Revenue | $22.50B | $22.39B | $24.6B–$27.6B |
| Non-GAAP EPS | ~$0.40 | $0.41 | $0.44–$0.55 |
| Auto GM ex-credits | ~12.5% (yr prior) | 19.2% | 18%–20% |
| Energy storage | ~9.6 GWh | 8.8 GWh | 13.5 GWh (reported) |
Guidance will likely matter as much as the backwards-looking print. Any H2 delivery run-rate below roughly 1.55 million annualized, or commentary that the $25 billion capex cycle extends deeper than planned, would weigh on a stock increasingly priced for execution rather than promises. For a broader read on demand, see our analysis of the “EV is dead” narrative versus actual US numbers.
The bottom line for the call
Five things decide the Q2 story: deliveries (known, a beat), auto gross margin ex-credits (the swing factor at 18–20%), energy storage (scaling and high-margin), the regulatory-credit cliff (structural decline), and capex/robotaxi spend (the $25 billion bet). None of this is investment advice. Tesla reports after the close on July 22 with a webcast at 5:30 p.m. ET, and the figures above are analyst consensus ranges, not a forecast. Watch the margin line first; everything else is context around whether the delivery win translated into durable profit.
When does Tesla report Q2 2026 earnings, and what time is the call?
Tesla releases Q2 2026 results after market close on Wednesday, July 22, 2026, with a live Q&A webcast at 5:30 p.m. Eastern Time. The delivery and energy-storage figures were already published on July 2, so only the financials and guidance are new at the call.
Why did Tesla stock fall after a big delivery beat?
Because the market has shifted from valuing unit volume to valuing profit quality. The 480,126 delivery beat was powered by China and Europe, while the US market is softer after the $7,500 federal credit expired on September 30, 2025. Investors now focus on automotive gross margin, regulatory-credit decline, and capex — not just how many cars were sold.
What is the consensus for Q2 2026 revenue and EPS?
Estimates are widely dispersed: revenue between roughly $24.6 billion and $27.6 billion, and non-GAAP EPS from about $0.44 to $0.55. The spread reflects uncertainty over pricing, margin trajectory, and the energy segment. Q1 2026 actuals were $22.39 billion in revenue and $0.41 non-GAAP EPS.
Sources: Tesla Q2 2026 Production, Deliveries & Deployments (ir.tesla.com / SEC 8-K, July 2, 2026); Tesla-compiled sell-side consensus (ir.tesla.com, June 26, 2026); Bloomberg consensus via hstong (July 17, 2026); AlphaStreet and TickerDaily Q2 preview; Tesorb earnings preview; William Blair regulatory-credit estimates (via Wall Street Observer / Futu); Visible Alpha analyst poll (14 analysts); Morgan Stanley robotaxi/capex note (via toutiao / longport); Nikkei Asia per-vehicle profit analysis (2026-07-14). All figures are analyst consensus, company-compiled estimates, or reported results as cited; none constitute investment advice.